Agentic Web Census
A monthly census of how ready the web is for AI agents: a score of our own, the AWCS, computed from HTTP Archive's public Lighthouse data and broken down by technology, by domain and by agent. And anyone can measure their own site against it.
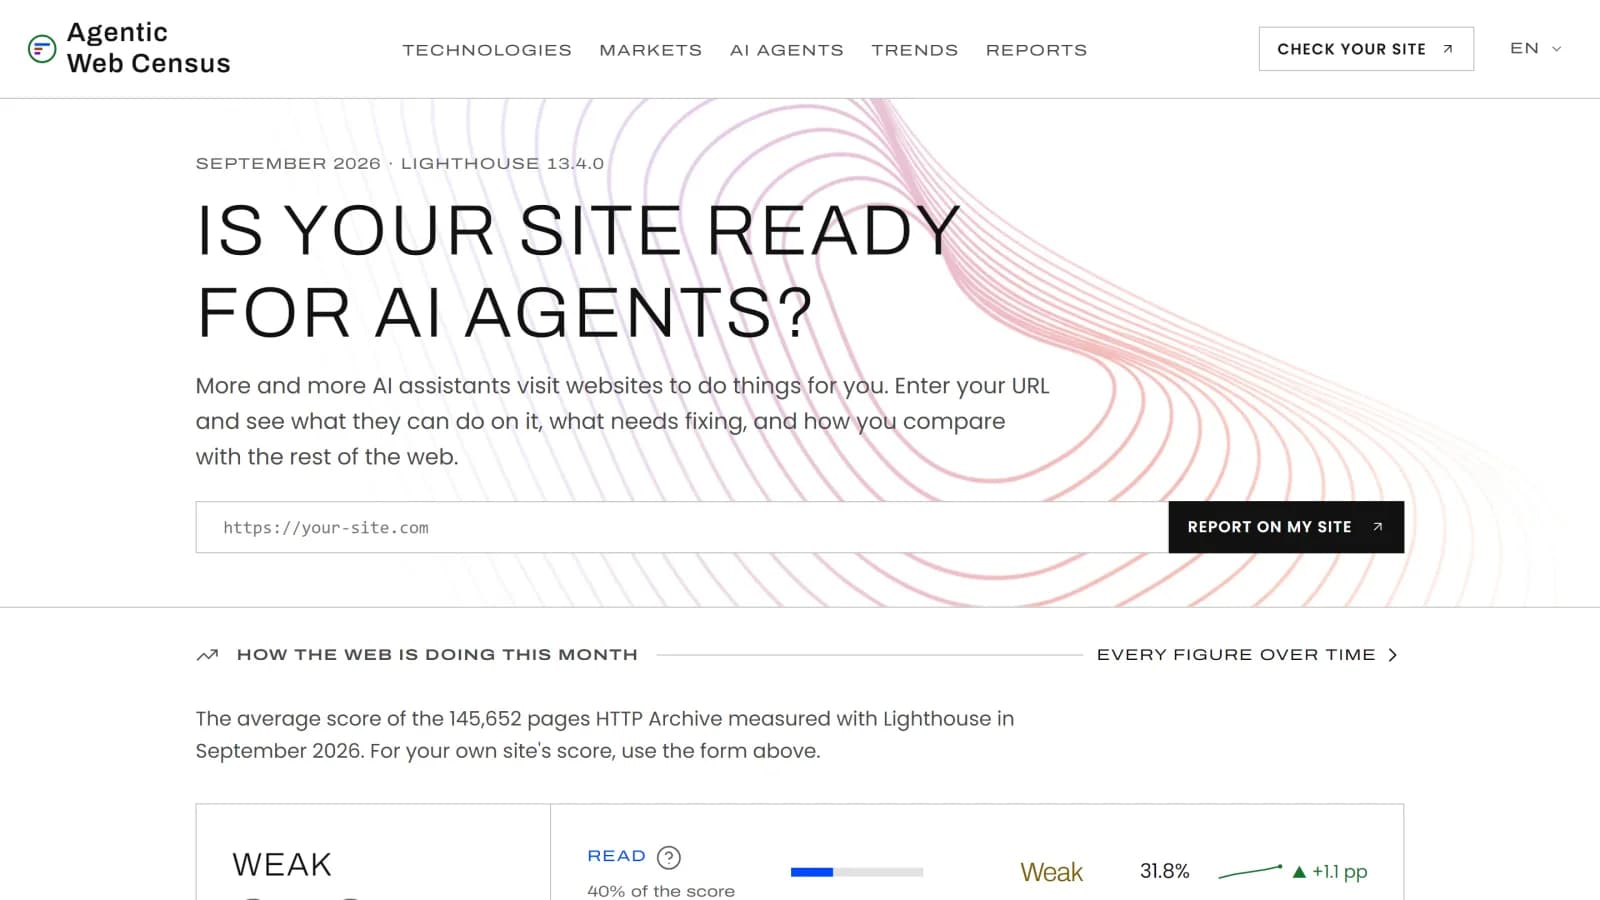
More and more of the visits to a website are not made by a person but by an AI assistant that has to read the page, understand it and sometimes do something on it: find a price, fill in a form. A site built only for human eyes can be invisible to it, and nobody was putting a number on how common that is.
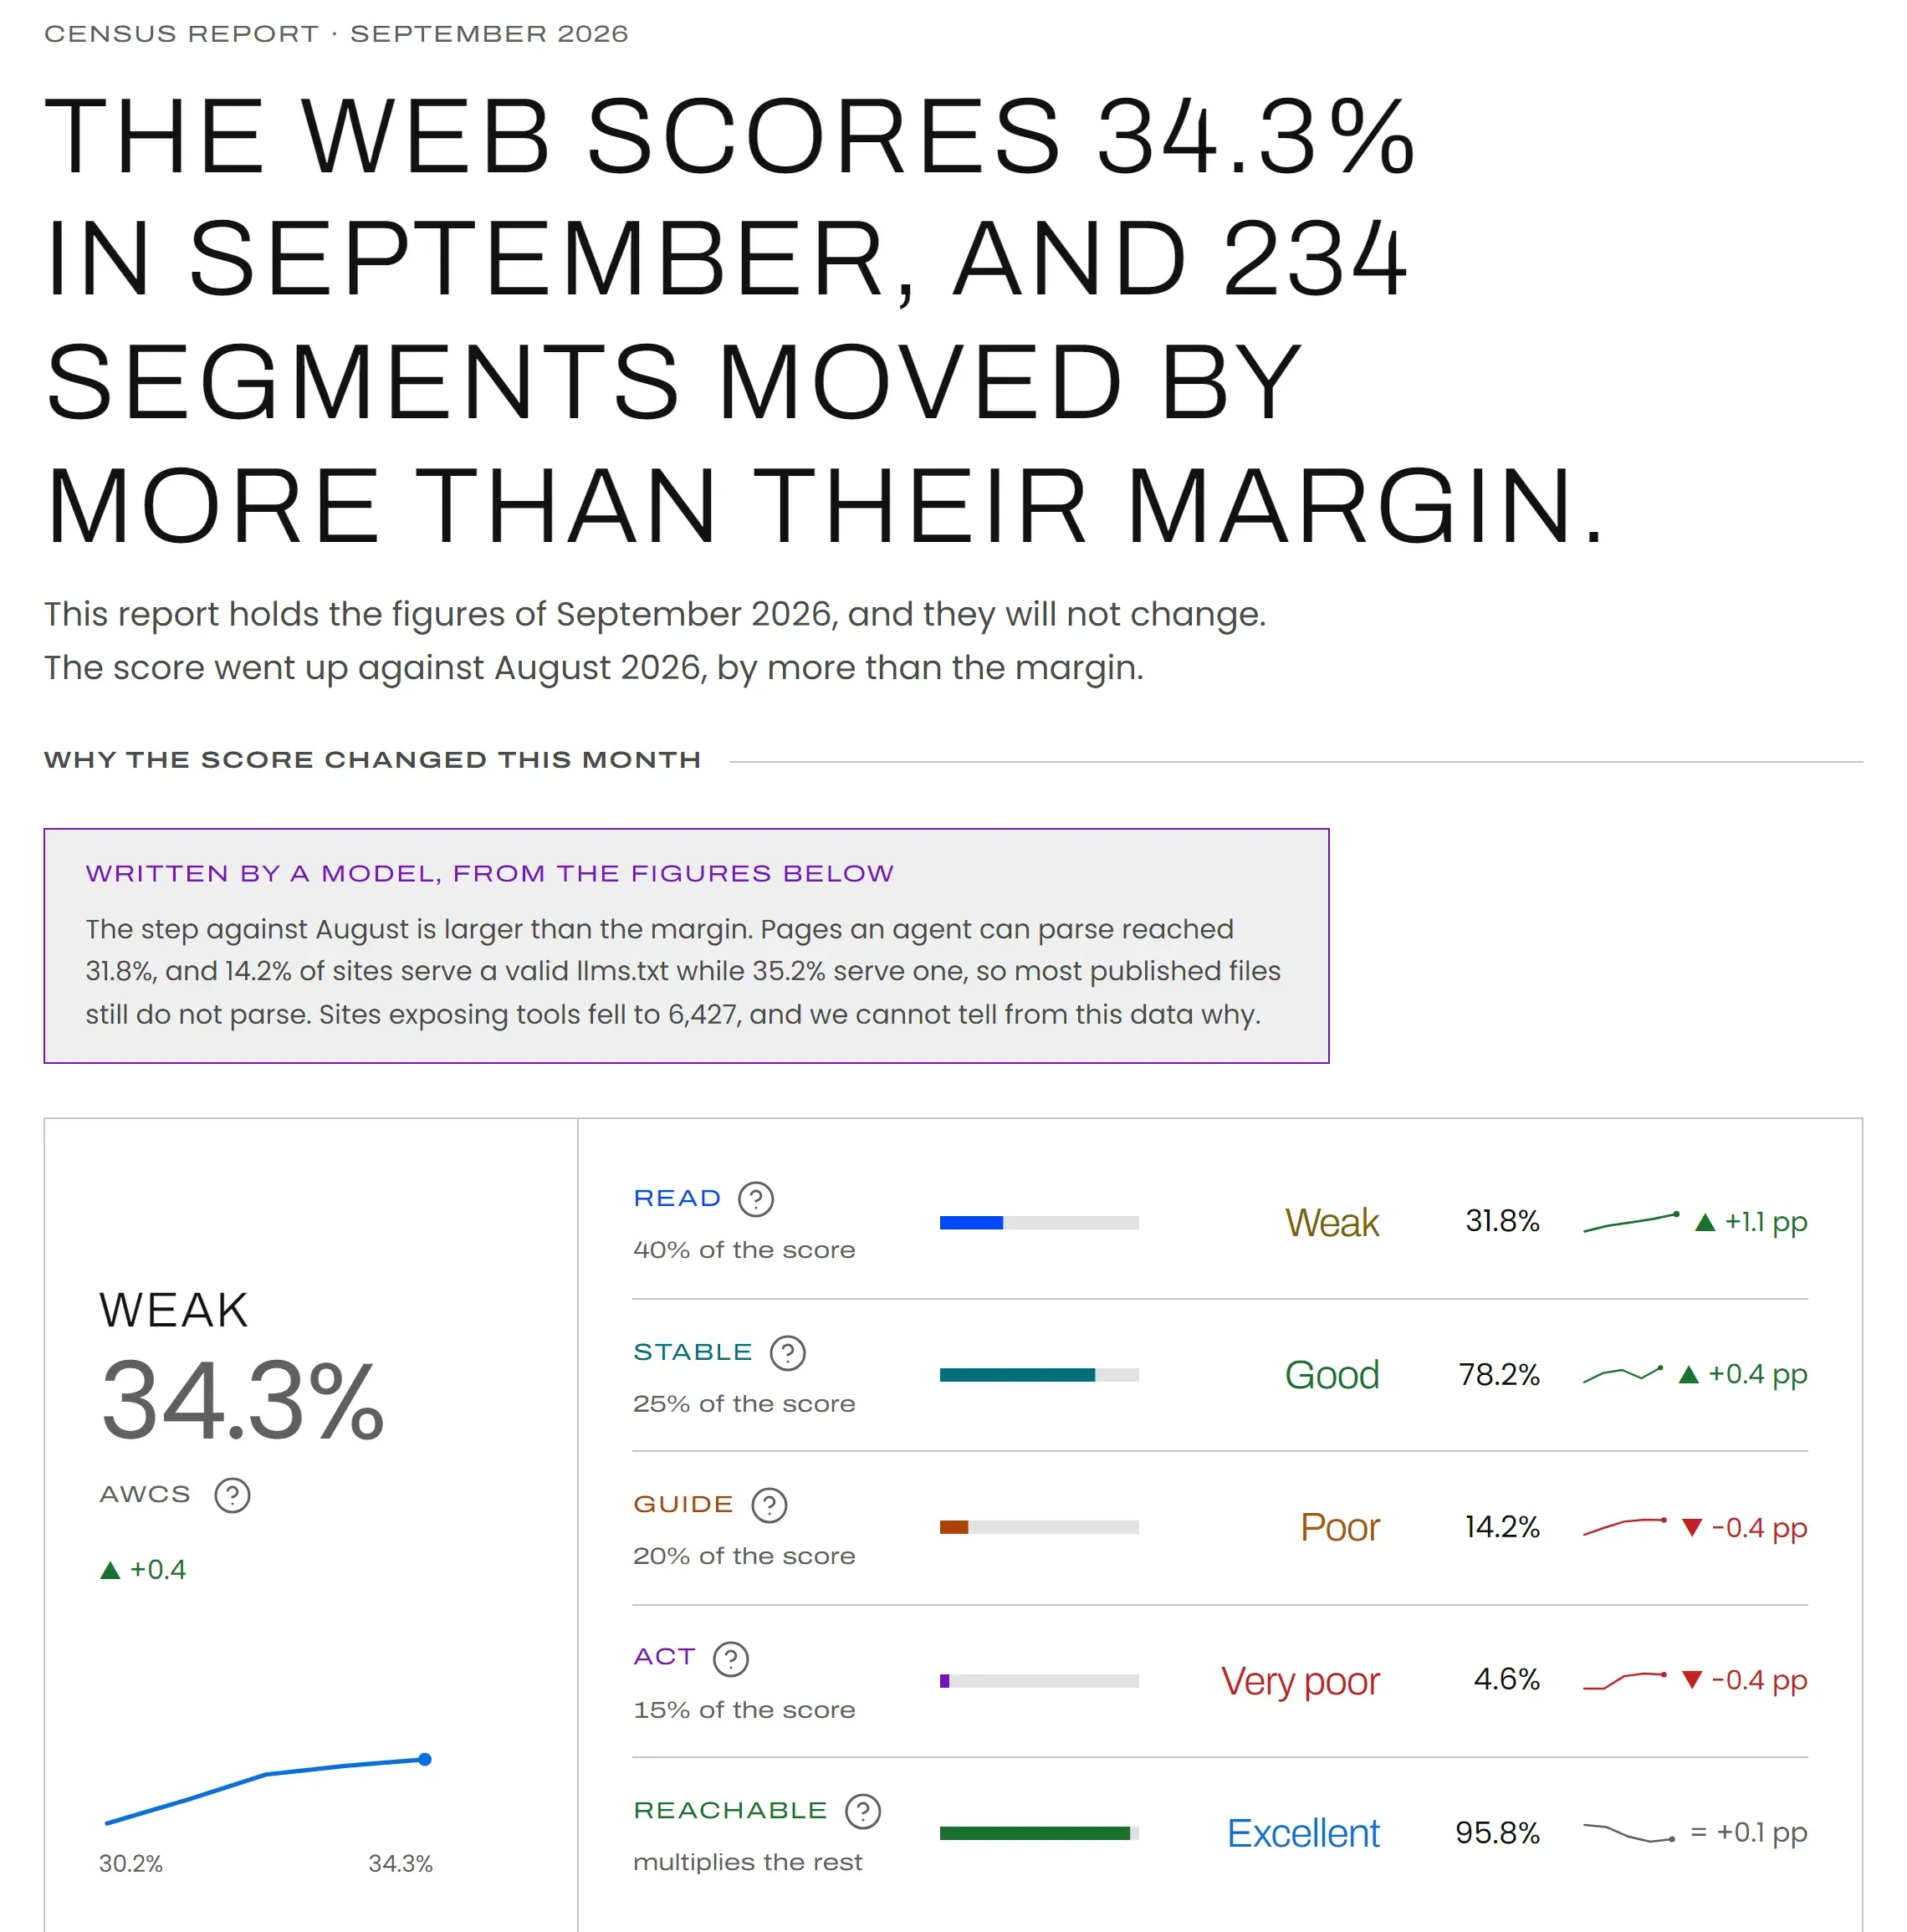
Agentic Web Census is that number. Every month it reads a 1% sample of the pages HTTP Archive audits with Lighthouse — some 140,000 — computes a score from 0 to 100% and publishes it for the whole web, by technology, by domain and by AI agent. In September 2026 the web averages 34.3%: weak, but four points above May.
The score: four dimensions and a multiplier
Lighthouse, Google's tool for auditing web pages, has a category of audits written for agents: Agentic Browsing. The AWCS score is built from those audits, plus one we measure ourselves, and we are the ones who decide how they add up:
- Read, 40% — An agent can work out how the page is organised from its HTML alone. It comes first because an agent that cannot read the page gets nowhere. 31.8% of the web passes it.
- Stable, 25% — The page holds still while it loads, because a button that jumps makes the agent click the wrong thing. 78.2% passes it.
- Guide, 20% — The site serves an llms.txt at its root, and it parses. 35.2% serve one, but only 14.2% serve a valid one: most published files do not count yet.
- Act, 15% — The site exposes WebMCP tools an agent can actually call. Only 4.6%.
- Reachable, multiplies the rest — The robots.txt does not turn AI agents away. It does not add, it multiplies: a site that does everything right but shuts every agent out scores zero, because an agent the robots.txt turns away never even asks for the page. Lighthouse does not audit this, so we read it ourselves.
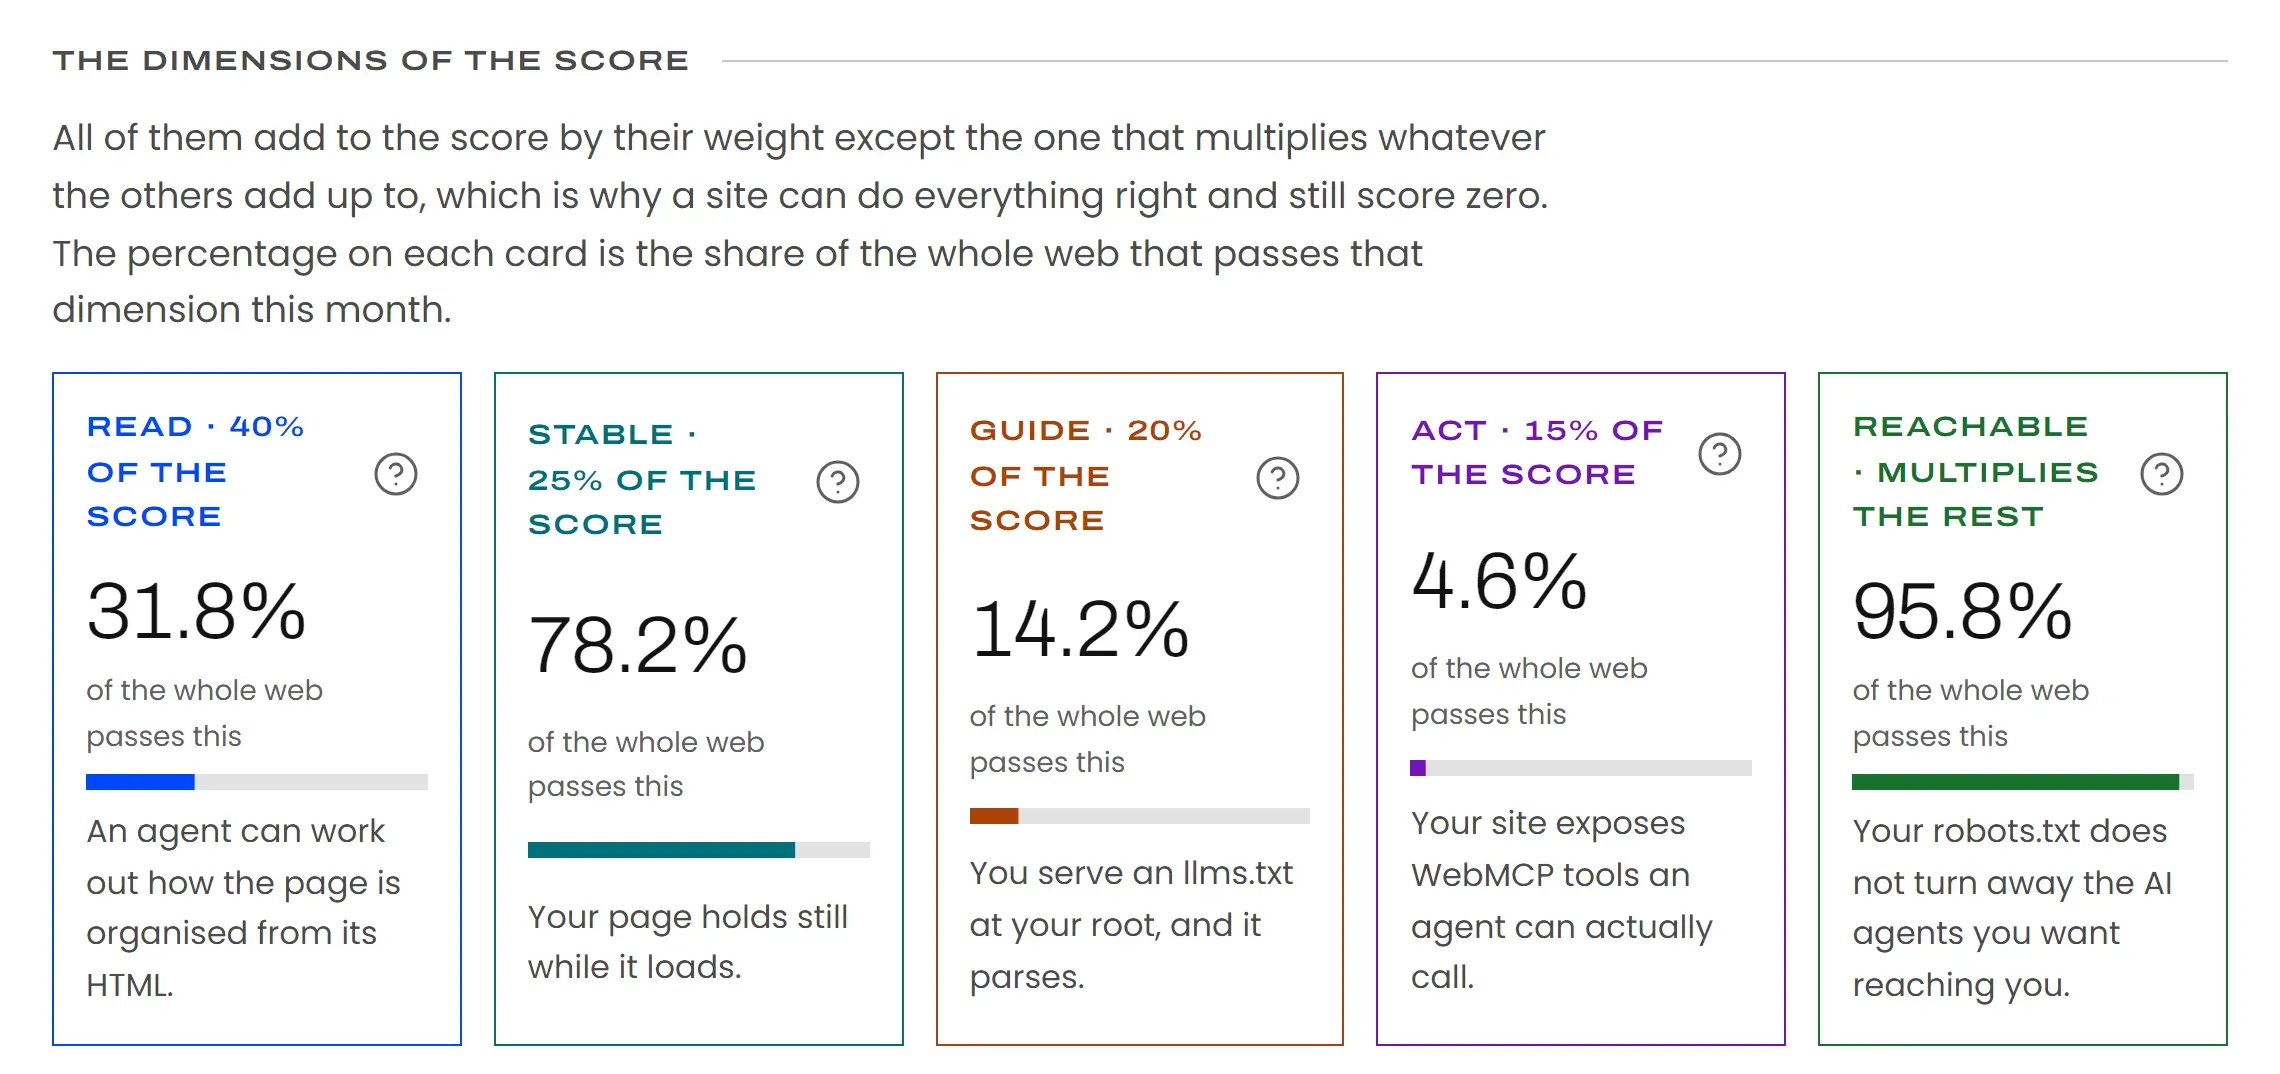
The score is computed in one place, a PostgreSQL function, so a single site's figure and the census's come out of exactly the same formula. And every figure carries a word, from “very poor” to “excellent”, because almost no site gets near the top of this scale and 34% with no context says nothing.
By technology, by market and by agent
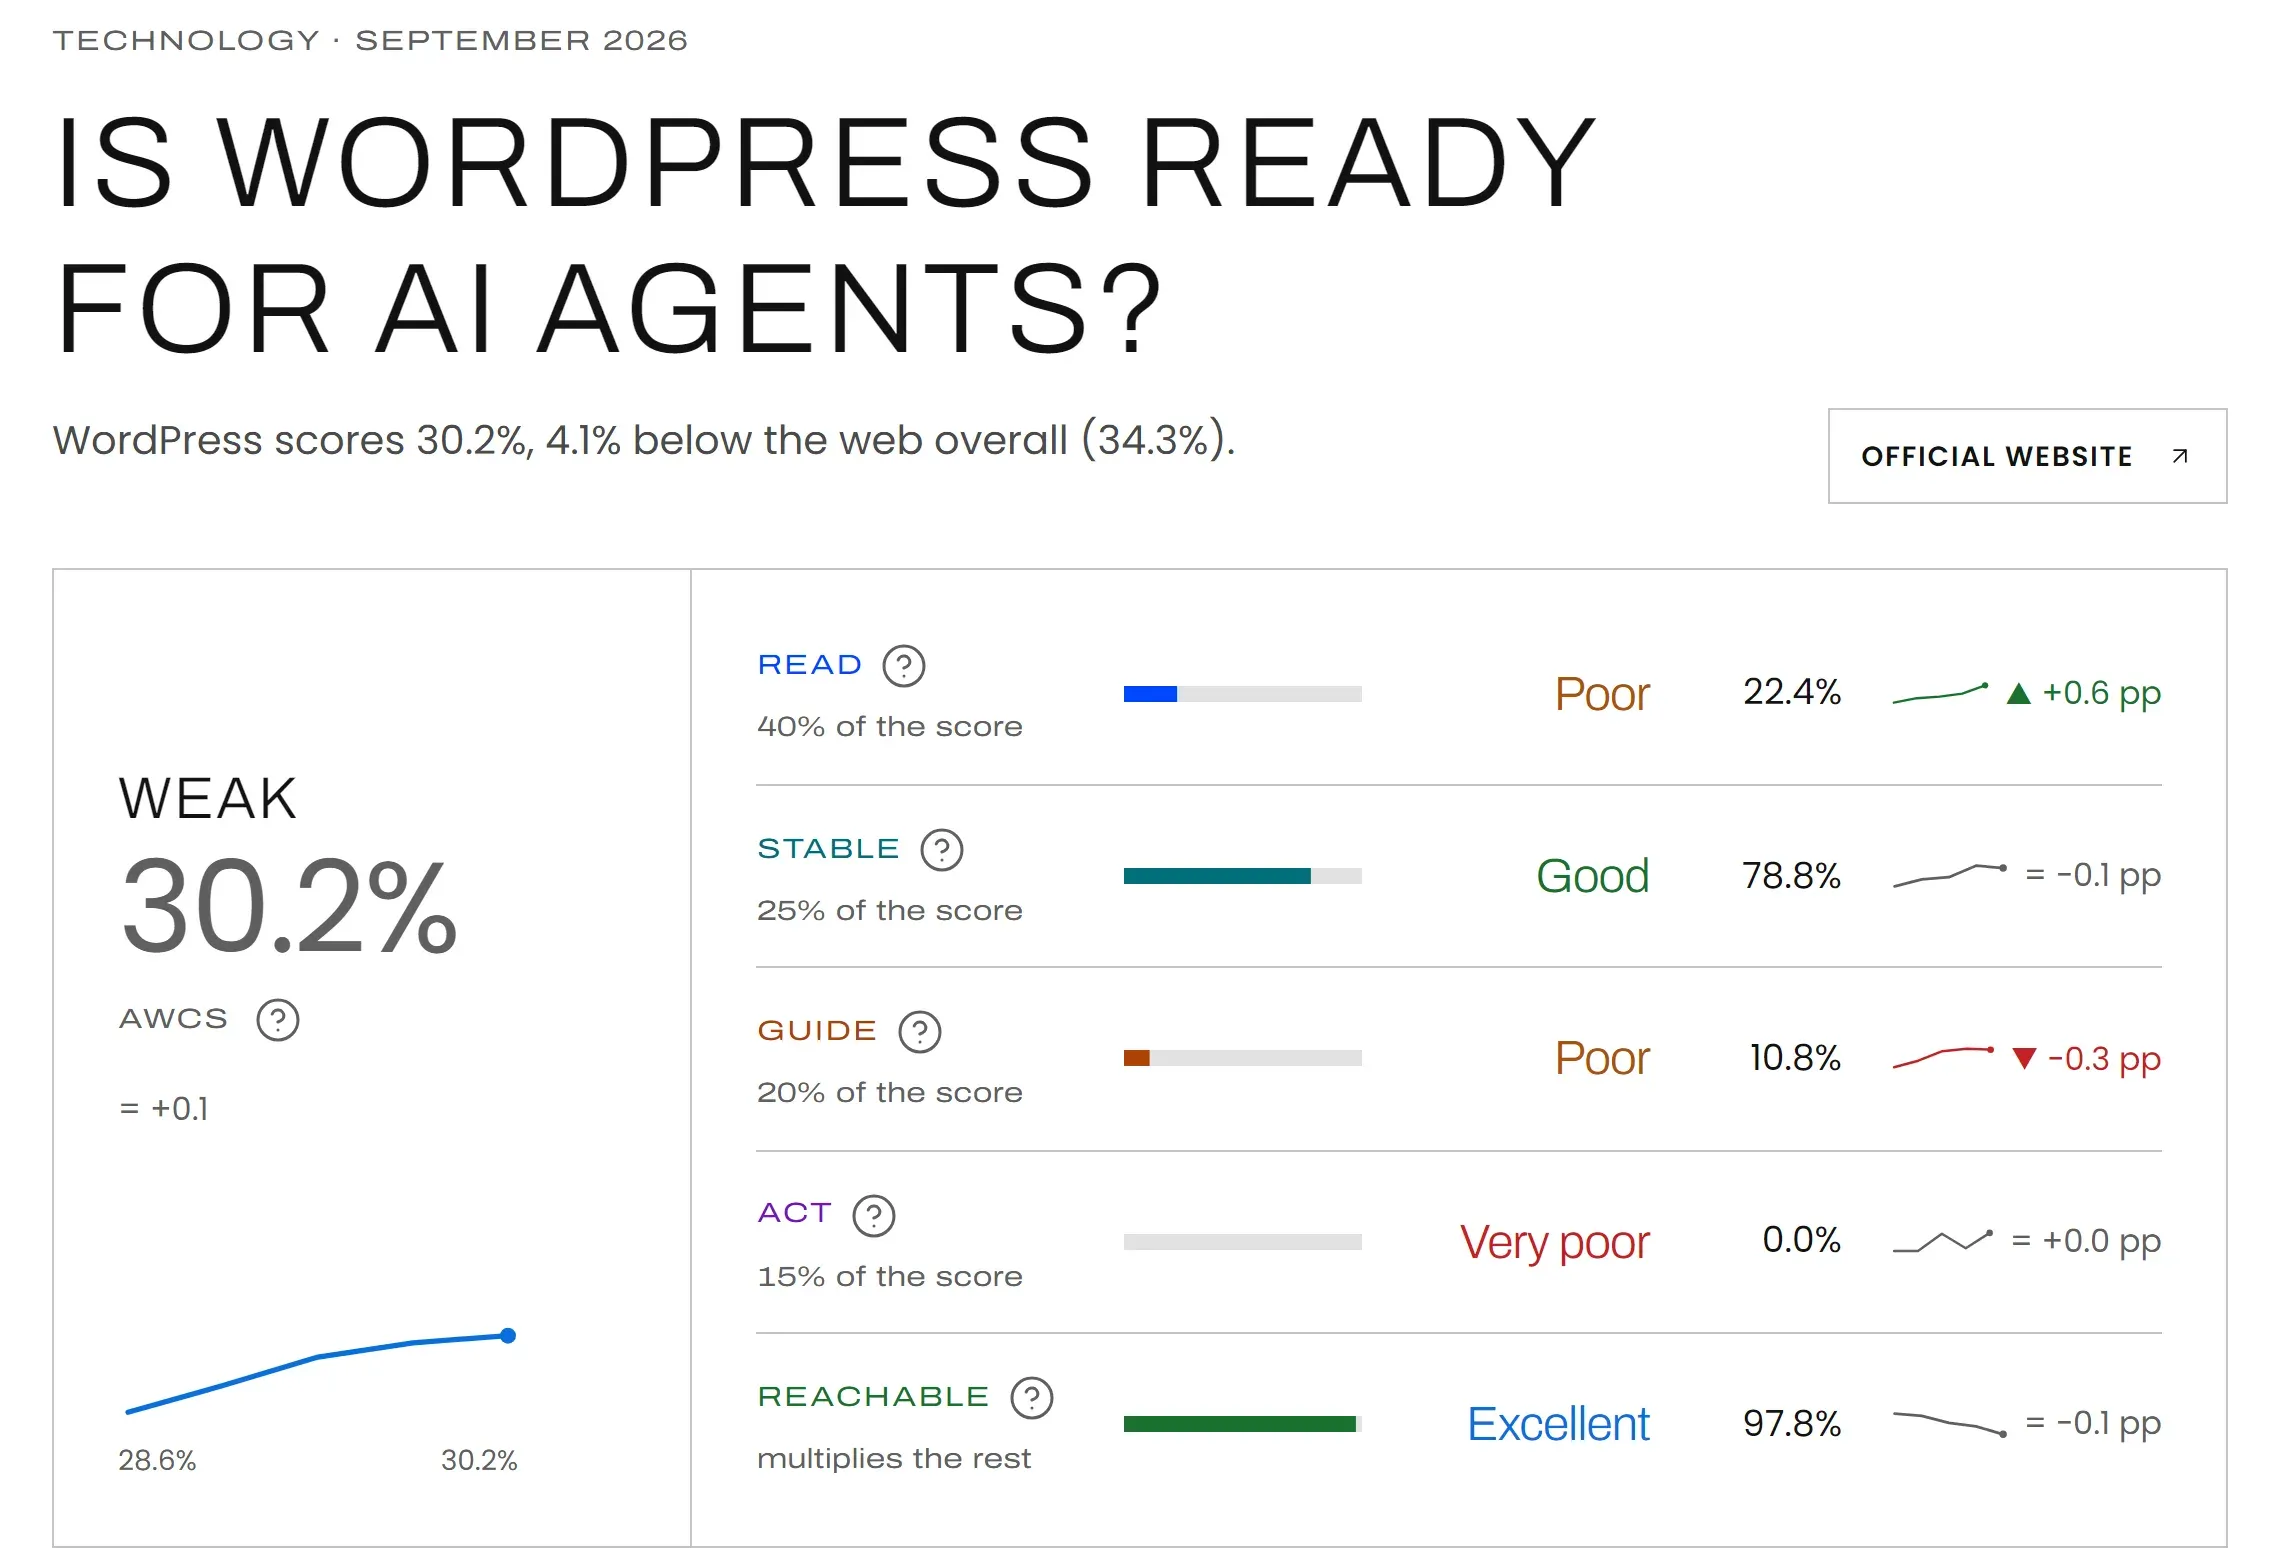
The census crosses the score with the technologies each site uses: more than 700, grouped into categories, each with its own page and, where the sample allows it, a score for every major version. That is how you see, for instance, that WordPress scores 30.2%, four points below the web, and loses them mostly on Read; or that among CMSs Shopify and Wix are above 58% while Magento and Squarespace stay under 18%.
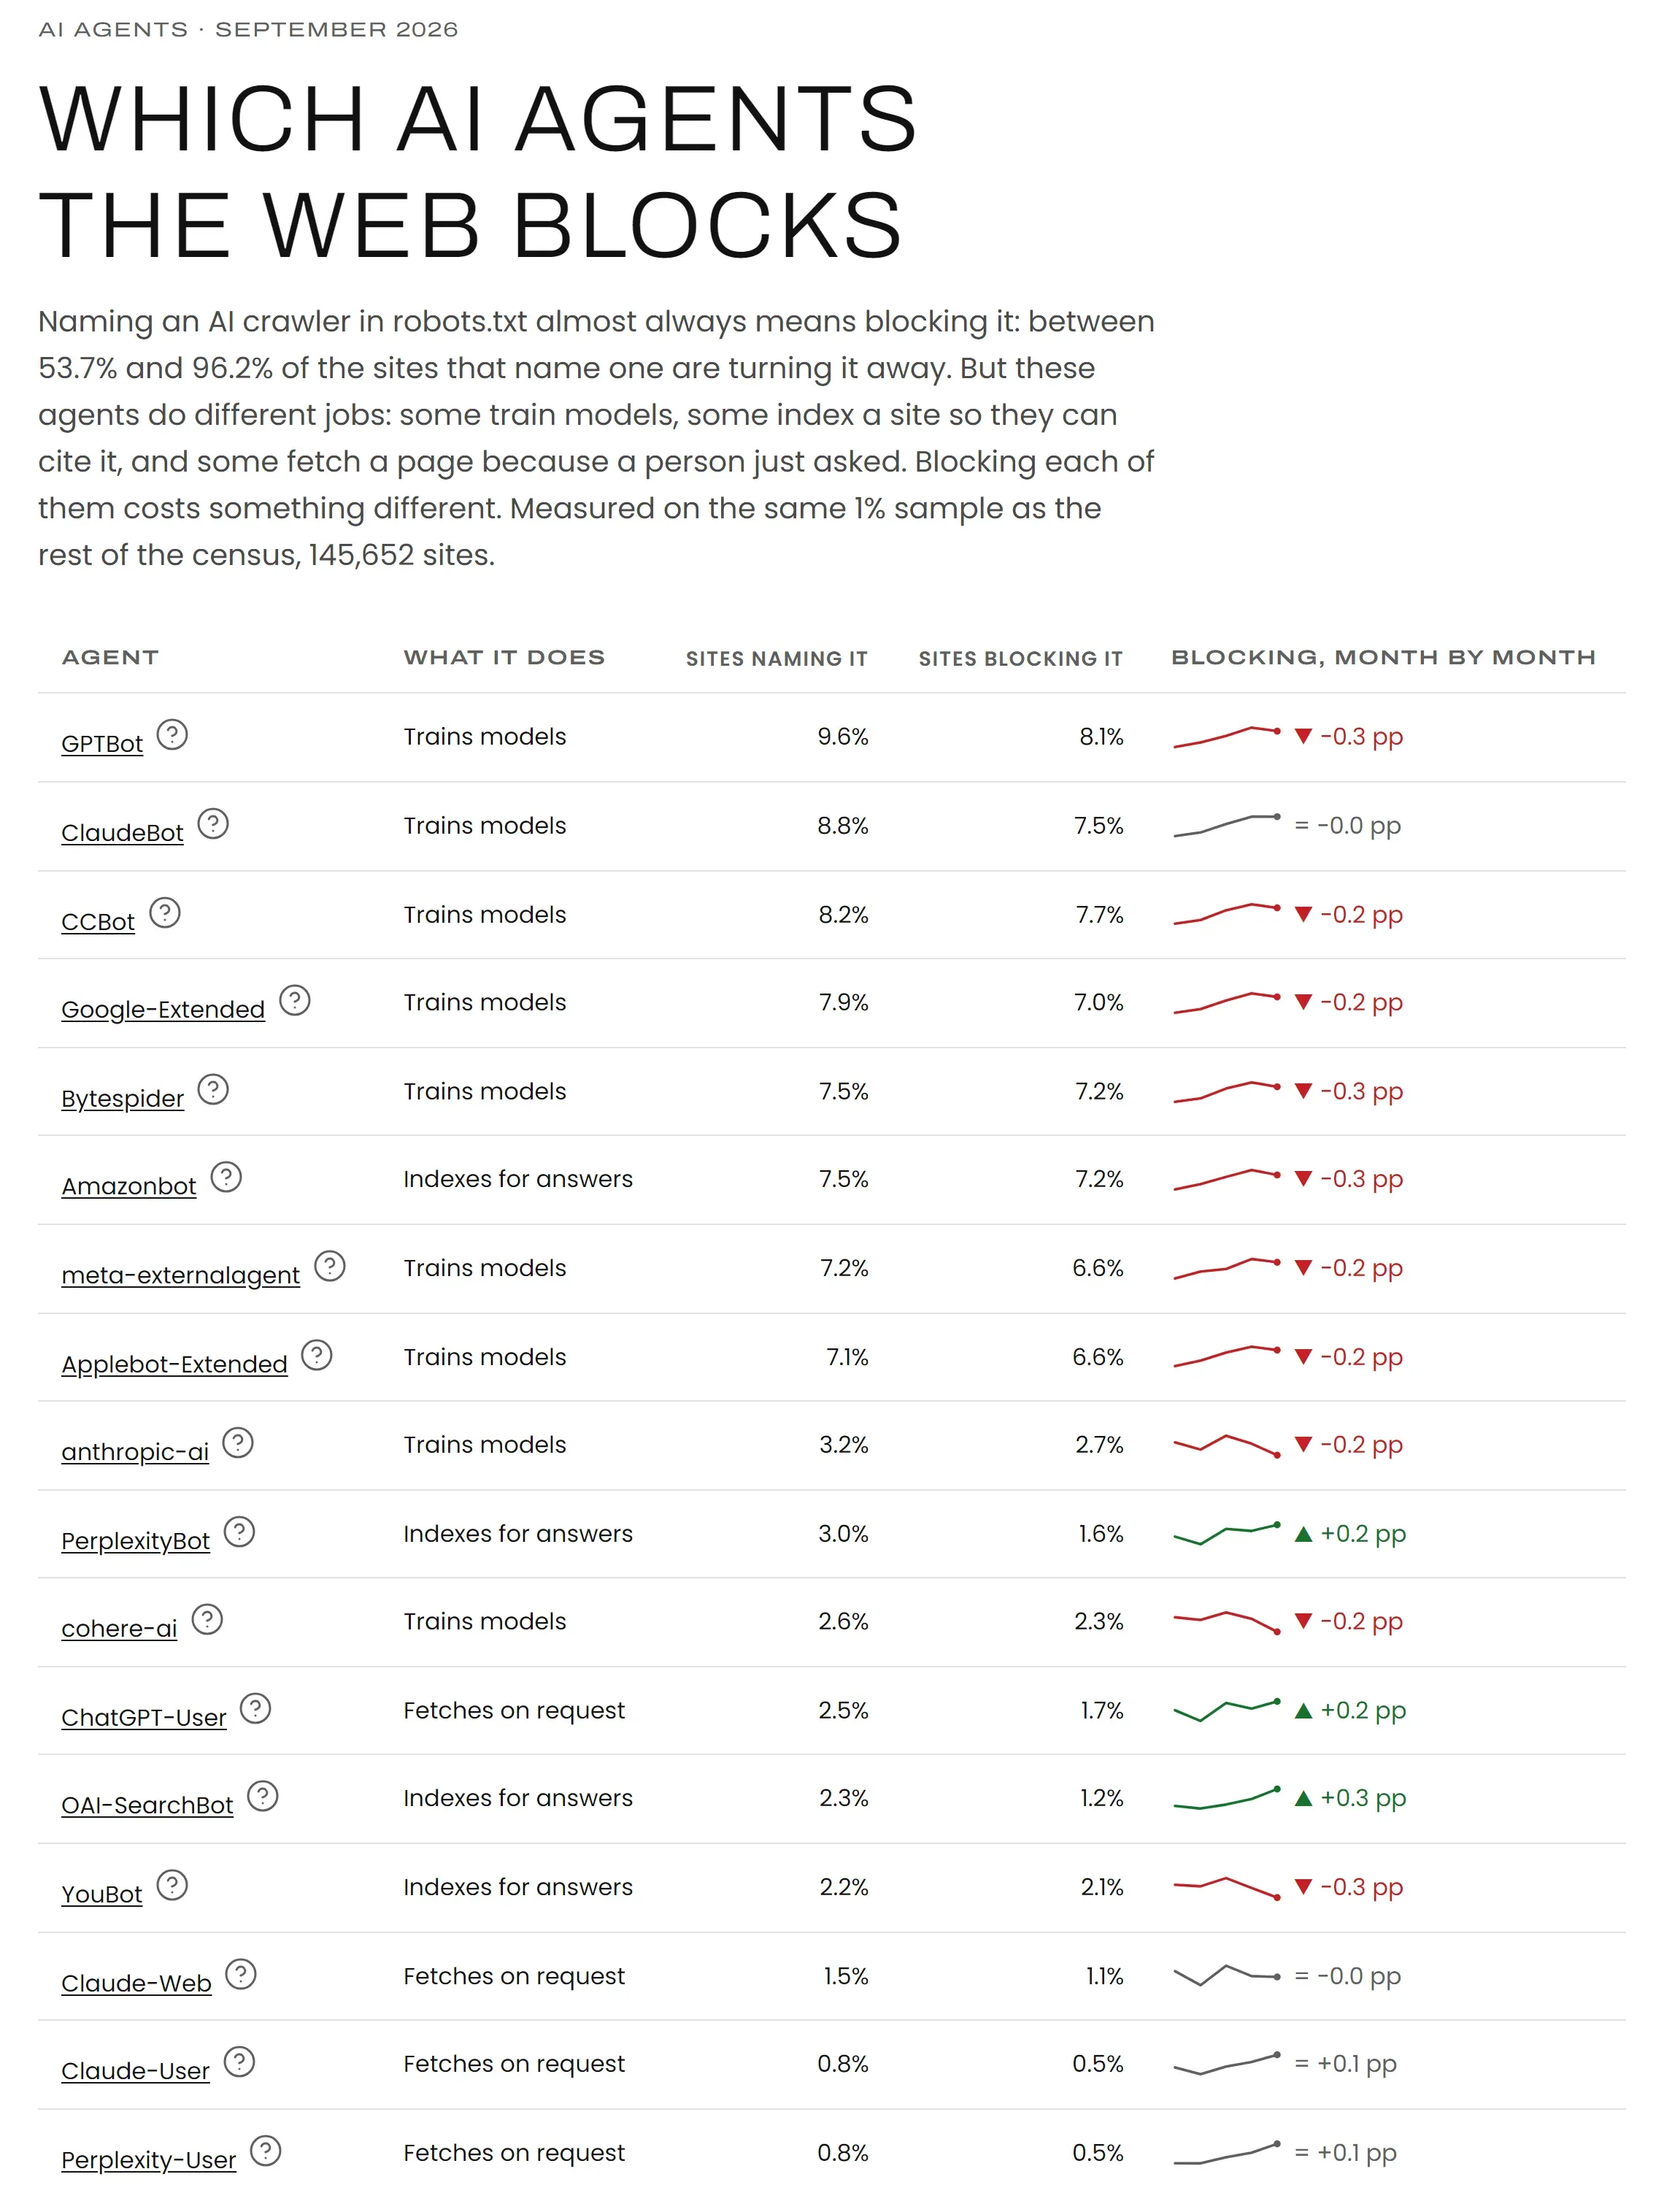
The same by domain suffix — 107 of them, 85 country suffixes, the closest the census gets to a reading by market — and by AI agent: which of the 17 we track are named in each robots.txt, and whether the rule lets them through. They do not all do the same job: some train models, some index a site so they can cite it, and some fetch a page because a person just asked. Blocking each of them costs something different.
Figures you can cite
Every figure carries the sample it came from and its margin of error, and it is only published when it rests on at least a hundred pages. A movement smaller than its margin is published as a tie, never as a rise or a fall: it is the only way a monthly series does not report noise as news.
Each month is frozen in a report with a permanent URL and its own JSON data file, so anyone can check it. The report says which segments moved more than their margin, which technologies score highest and lowest, and what is worth doing that month. The paragraph explaining why the score changed is written by a model from the figures, and it says so. Everything is published under CC BY 4.0.
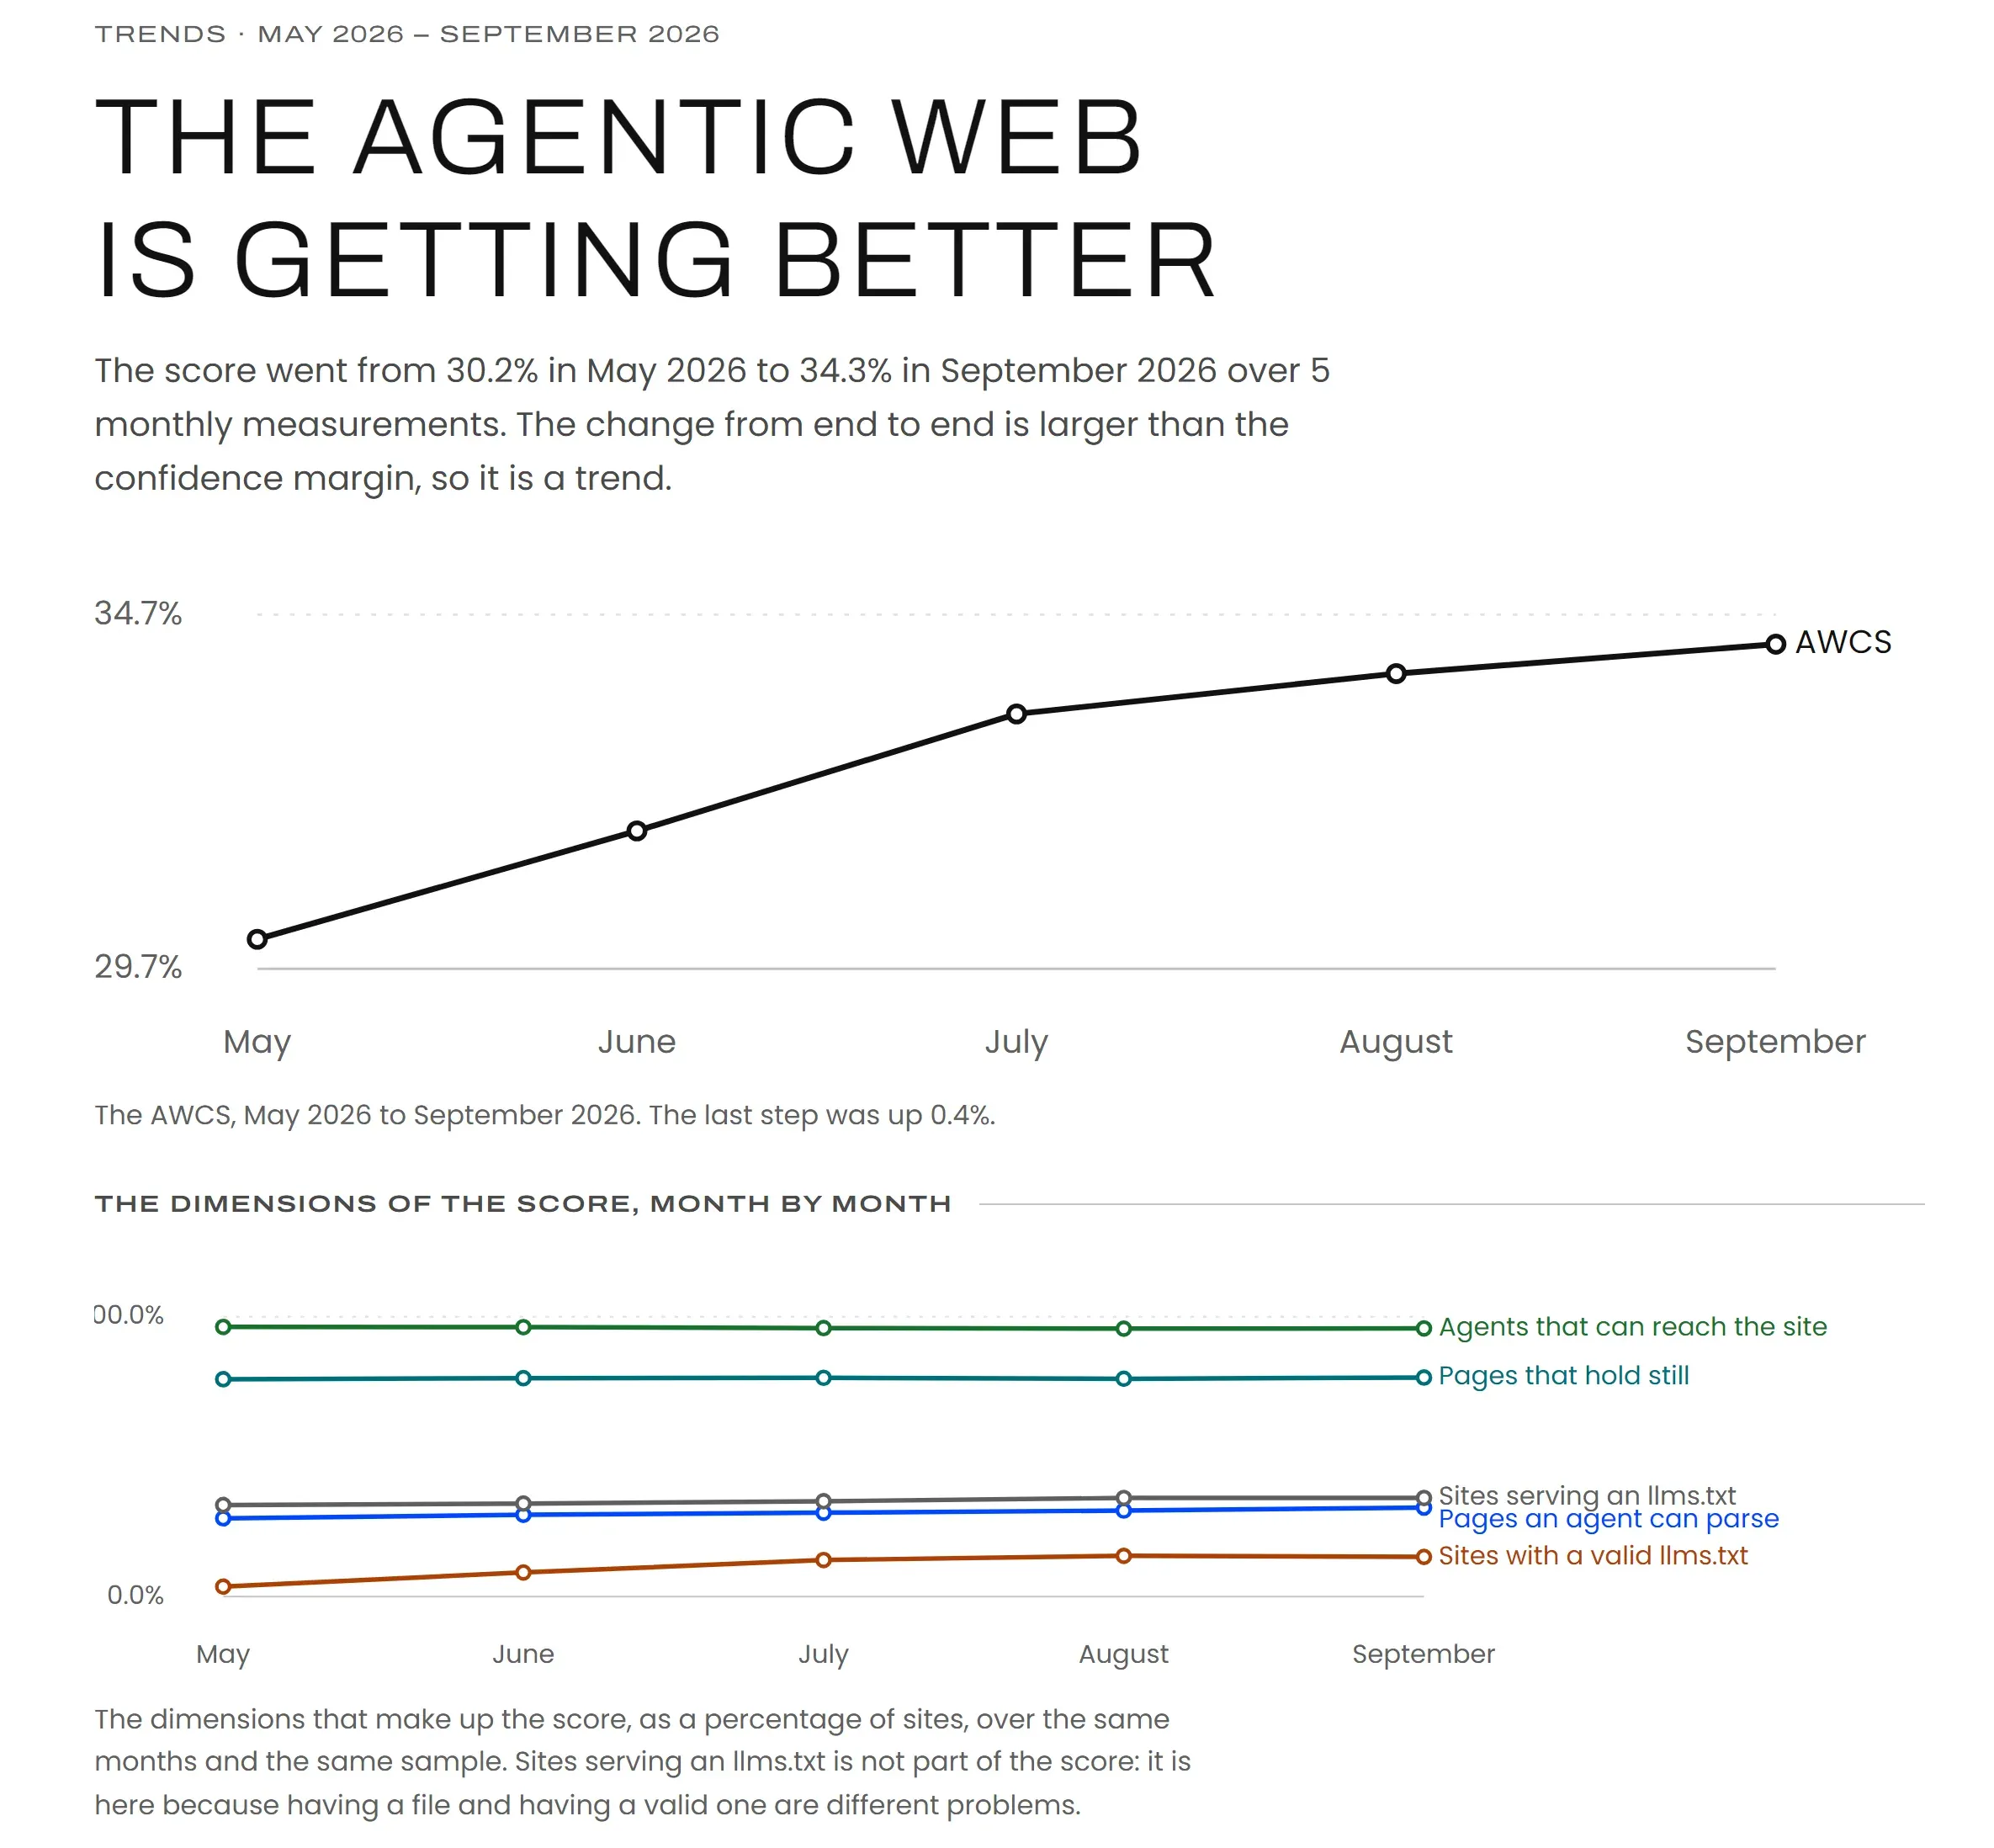
The trends page shows the whole series: from 30.2% in May to 34.3% in September, a change comfortably larger than the margin, which is what makes it a trend.
Your site, against the census
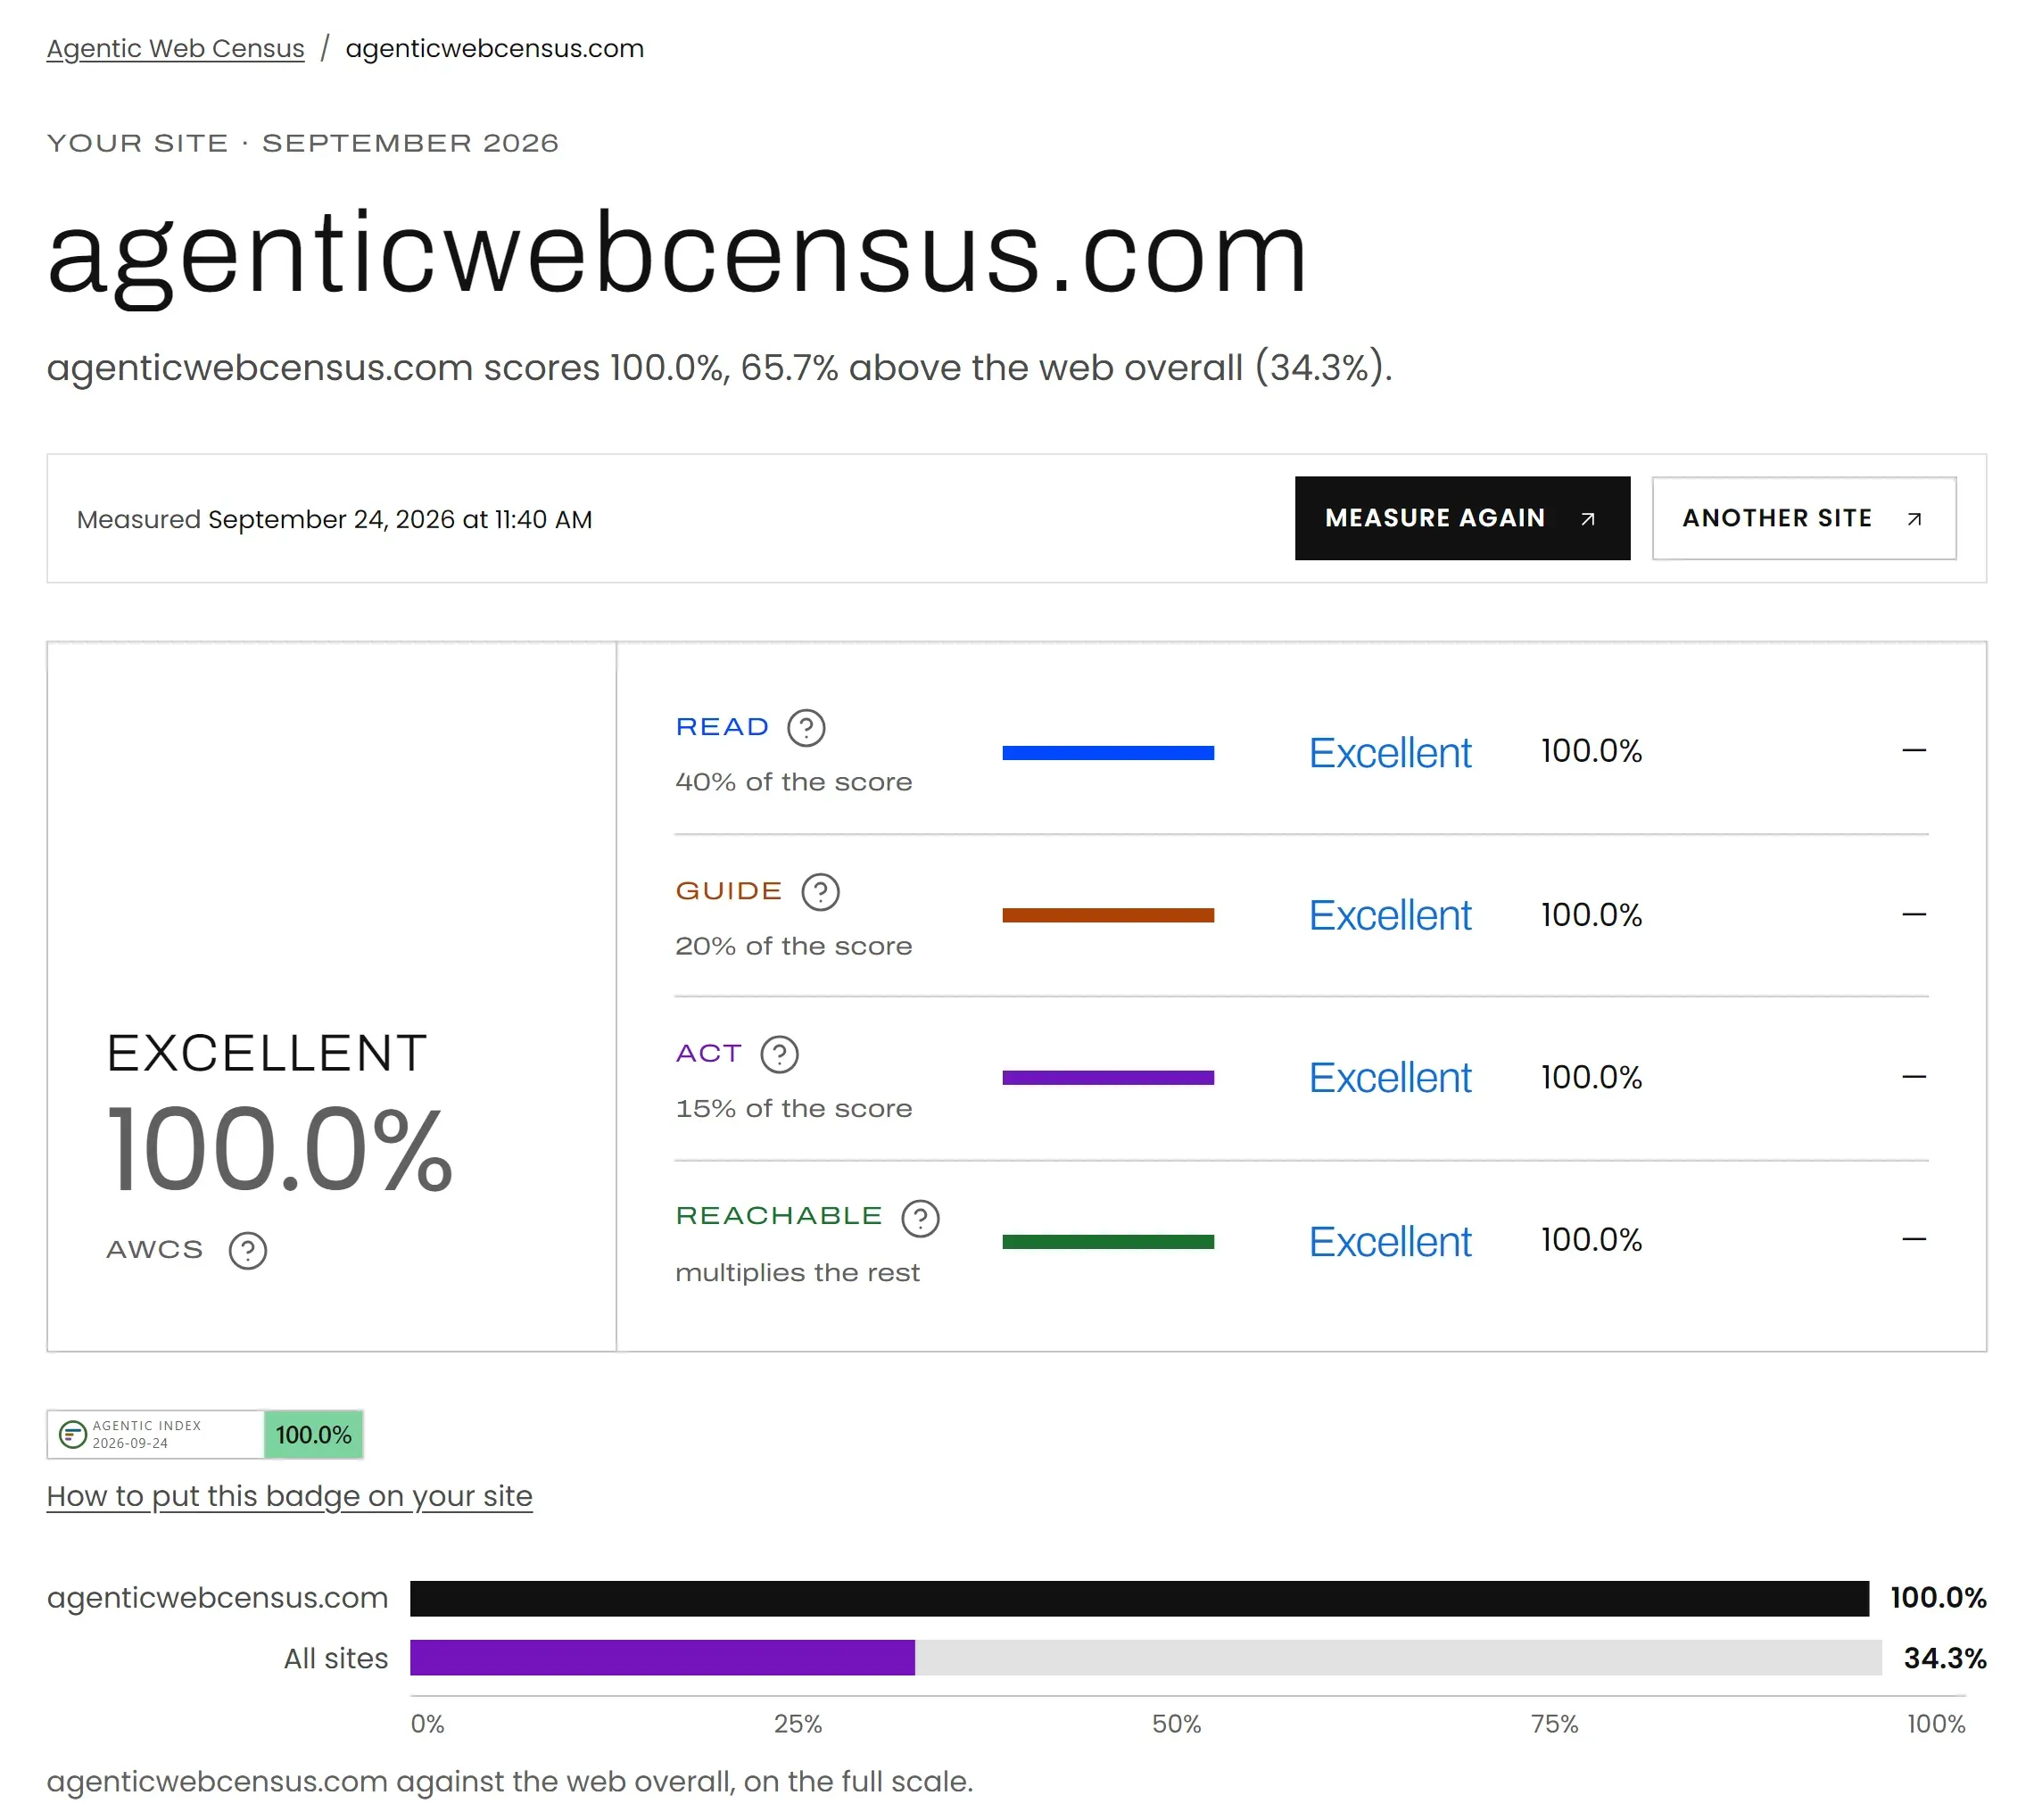
Anyone can type in their URL and, with no account and no tracking, get their site's score measured the same way as the census: PageSpeed Insights runs the same Lighthouse, at the same version, and we read the robots.txt. The result says which dimension loses points and what fixing it is worth. It is not indexed: anyone can ask for a report on any site, and we do not put reports on other people's sites in Google.
From there, there is a free plan by email, a paid advanced report with the server's own headers and code ready to paste and, for whoever prefers it, Omitsis making the changes and measuring them again.
Practising what it preaches
A census that scores everyone else has to pass its own score, and agenticwebcensus.com scores 100%. Its pages are static, built with Astro and in three languages; the site serves its own llms.txt, exposes the report form as a WebMCP tool so an agent can ask for a report without going through the screen, and has a robots.txt that lets every agent in in writing, not by saying nothing. A site that measures whether agents can reach you and then turns them away would be judging others by a rule it does not keep.
Nor does it claim to be more than it is. The AWCS is not a quality score or an SEO score: it says nothing about a site's design, its writing or its speed, and it has no opinion on whether you should let agents in. If you have decided not to, a low Reachable is that decision working.